FEATURES
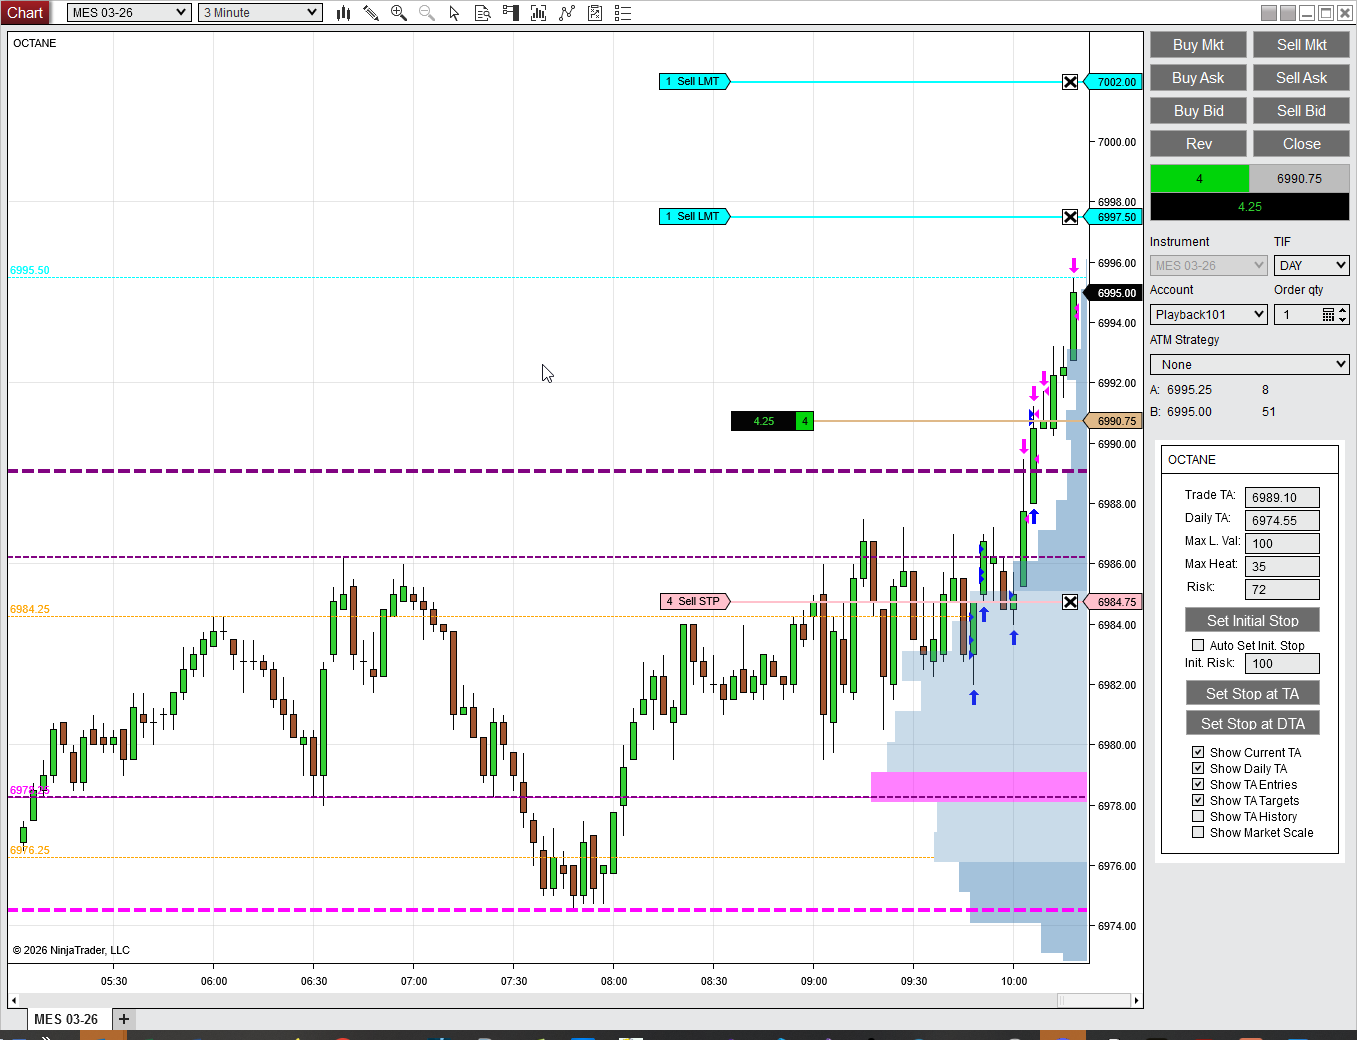
The On Chart Theoretical Average and Next Entry/Exit
OCTANE is not another signal generator. It shows your financial exposure to the market: where you stand, what it really costs, and how your next move changes the picture.
COST BASIS
Every commission. Every fill. On the chart.
Your platform shows gross P&L. OCTANE shows your Theoretical Average: the actual price you need to beat to profit, with every commission included.
This is not a subtle distinction. If you are scalping ES futures and making six round turns in a session, those commissions can shift your break-even by several ticks. Your platform shows you in profit. Your account statement says otherwise. OCTANE puts the real number on the chart.
The calculation includes the cost to exit your current position. So the line on your chart is not "where you'd break even if commissions didn't exist." It is "where you break even right now, in reality, if you flatten."
READING THE CHART
What you are looking at
The Trade TA (darker purple line)
Your current trade's theoretical average, with all commissions included. This is your real break-even for the open position. If price is above this line on a long, you are genuinely profitable after all costs.
The Daily TA (dark pink line)
Your cumulative break-even across every trade in the session. If your earlier trades were winners, the Daily TA reflects that accumulated profit. Set your stop here and you protect the day, not just the current trade.
Projection lines (lighter weight, same color as Trade TA)
These show where your Trade TA moves if your scale-out orders fill. In this chart, there are two profit-taking levels set. When the first one fills, the Trade TA drops and your current risk of 72 ticks drops to around 20. When the second fills, the lighter projection line sits below the current stop, which means you are guaranteed profit at that point. The market can do whatever it wants; you have already won.
The OCTANE panel (right side)
Trade TA, Daily TA, Max Loss Hit, Max Hold, and current Risk are always visible. The stop management buttons let you set your stop at the Trade TA or Daily TA with one click. Auto Set/Adj Stop moves your protection automatically as your theoretical average improves.
Should you add a contract? Scale out half? OCTANE answers before you click.
The Next Entry/Exit component displays how your theoretical average changes if a pending order fills. This runs in real time against your actual open position with your actual commission structure.
Adding to a winner moves your average closer to the current market price. That tightens your margin. OCTANE shows you by exactly how much. Taking partial profits moves your average further from market price. That widens your margin. OCTANE shows you that too.
The preview includes the commission on the new contracts. So when you see the projected new average, it is the real number, not the optimistic one.
PREVIEW
See the result before you pull the trigger
ENTRY PROJECTIONS
See what happens before it happens
Adding above the market (buy stop)
Place a buy stop above the current price and OCTANE draws an orange line showing where your Trade TA would move if that order fills. You can see immediately how much adding a contract at that level tightens your margin, and whether the potential gain justifies the additional risk.
Adding below the market (buy limit)
A buy limit below the current price but above your TA improves your average. The orange projection line shows the new TA if that order fills. If the trade goes against you and you are scaling in, the projection appears below the current TA, showing you exactly how much your cost basis improves with the additional contract.
Orange entry lines
Entry projections appear in orange to distinguish them from the purple Trade TA and its scale-out projections. Toggle them on or off with the "Show TA Entries" checkbox in the OCTANE panel. The weight of the line matches the Trade TA so you can compare them at a glance.
SESSION
Your whole session, one number
Individual trades are one thing. Your day is another.
The Daily TA tracks your aggregate cost basis across every trade in the session. When you are three trades in and two were winners, the Daily TA reflects that accumulated profit. It shows you your true daily break-even.
Place your stop above the Daily TA and you have created a floor. Even if the current trade goes completely against you, you still walk away with a profit for the day. The money at risk on this trade is money the market gave you earlier in the session, not money you brought from home.
OCTANE integrates stop placement directly with your theoretical average.
Set Stop at TA places your stop at the current trade's theoretical average. From that point, the trade costs you nothing. You are playing with house money.
Set Stop at OTA places your stop relative to the overall (daily) theoretical average. This protects your session profit, not just the current trade.
Auto Set/Adj Stop automatically adjusts your stop as your theoretical average improves. As you scale in and out and your position becomes more favorable, your protection moves with it.
No mental math. No calculator open in another window. The stop levels are derived from your actual cost basis, and they update in real time.
PROTECTION
One click to break-even. One click to protect the day.
PSYCHOLOGY
Pressing winners without guessing
The pattern that costs retail traders the most money: cutting winners too short. A trade goes in your favor, fear kicks in, and you grab a small profit when a larger one was available.
The fear is understandable. Adding to a winning position moves your average closer to the market. Your break-even tightens. Without knowing the exact numbers, it feels like gambling your profit.
OCTANE turns that feeling into a calculation. In a strong trend, adding a contract might move your break-even by a few ticks while giving you significantly more profit potential. OCTANE shows you that. In a choppy market, the same add might bring your break-even into the noise. OCTANE shows you that too.
The decision is still yours. But now it is informed by visible numbers, not driven by fear.
For NinjaTrader 8
Monthly and annual plans. No feature gating. Cancel anytime.