
NINJATRADER 8 INDICATOR
The chart shows the market. OCTANE shows you where you stand in it.
OCTANE (On Chart Theoretical Average and Next Entry/Exit) shows your actual cost basis while you are in a trade, right on your chart. Every scale-in, scale-out, and commission is factored in.
These concrete levels show you not only where you are, but how your profitability and risk change as you manage your trade.
THE PROBLEM
Your charts are designed to show the market, not where you are in it
Getting in and out of the market is never free. Between exchange fees and broker commissions, every fill costs you something. Most platforms show gross P&L, which tells you part of the story. The gap between that number and your real position is small if you trade once a day. It is enormous if you are scalping and stacking up round turns.
On CME E-micro contracts, where per-tick commission costs can be several times higher than E-minis, a trader watching gross P&L can believe they are having a good day while their account tells a different story.
OCTANE closes that gap. Every commission, on every fill, including the cost to flatten your current position, is baked into the number on your chart.
OCTANE IN ACTION
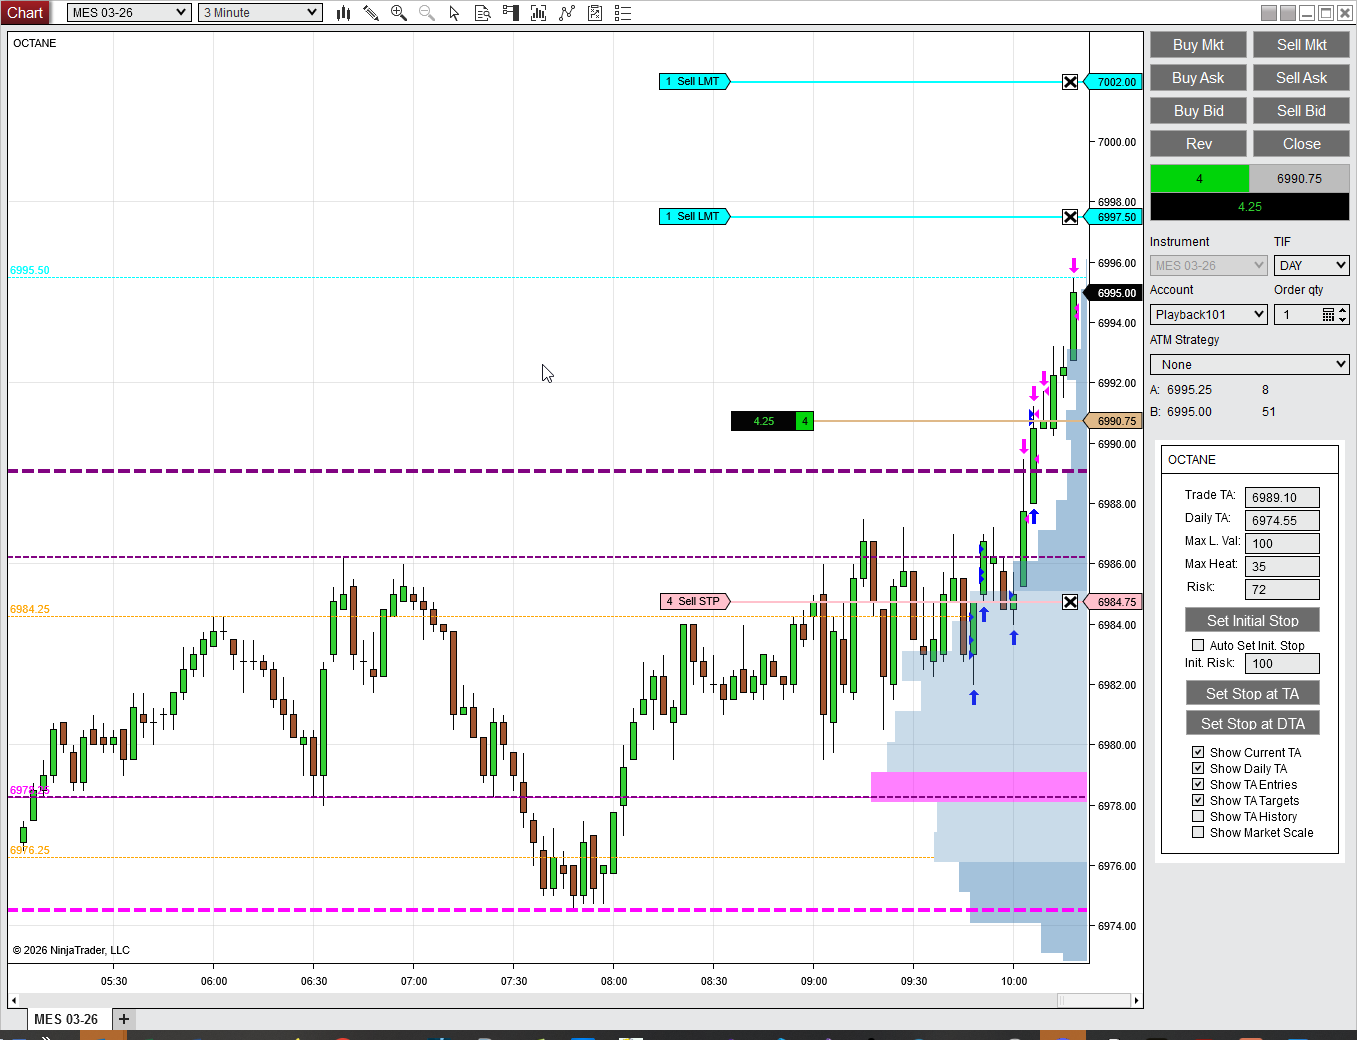
OCTANE on MES 3-minute chart. The green Trade TA line shows real break-even with commissions. Lighter dashed lines project where the TA moves if profit-taking orders fill.
01
Your Theoretical Average
Your real break-even point, plotted on the chart. Not gross. Not estimated. All commissions included. If price is on the right side of this line, you are genuinely profitable.
NEXT ENTRY PREVIEW
02
Your Next Move
Before you add to a position or scale out, see exactly how that changes your cost basis. The preview includes the commission on the new contracts. No guesswork.
03
Your Daily Position
OCTANE tracks your aggregate session. The Daily TA shows your cumulative break-even across every trade today. Place your stop above it and you cannot lose money you brought from home, only money the market gave you this session.

Trading is hard. Uncertainty makes it harder.
Two traders hold the same position. The market pulls back. One has built up profit through earlier trades. The other just entered. The move is identical. The pain is completely different.
OCTANE makes the boundary visible. You can see on the chart whether you are risking the market's money or your own. When that boundary is clear, the pullback that used to cause panic becomes manageable.
One click sets your stop at the theoretical average. One click and you are protected.